


Quality and Safety Programs
These programs and others help us continuously improve quality and safety across our network.
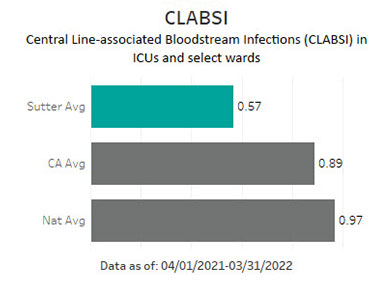
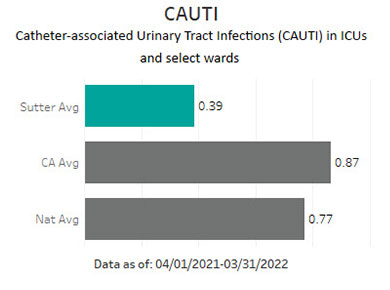
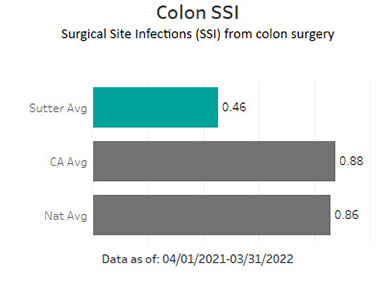
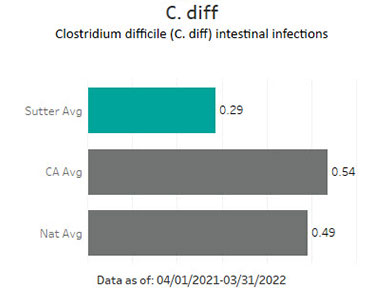
Hospital Acquired Infection (HAI) Reduction
System-wide initiative focused on using standard work to reduce the risk of a hospital acquired infection.
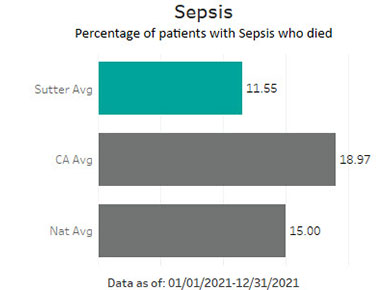
Sepsis Protocol
Implementing a system-wide sepsis protocol results in a reduction in sepsis related mortality.
eICU (electronic ICU)
Provides 24 hour telehealth surveillance of patients in the ICU, creating additional safety for patients.
ICU Liberation
Critically ill patients benefit from new care practices that improve outcomes.
Universal Protocol
Using a “surgical pause” wherever invasive procedures are performed to prevent surgical errors from occurring.
Sutter Safe Care
Over 60,000 employees and physicians have been trained in the use of error prevention tools and safety practices.
Sutter Health All Hospitals Quality Results